Thesis Companion
  • Home
  • Guide
    Coaching and feedback Skills and software Topic and research question Finding literature Managing your raw data Project pipeline Thesis outline Writing bootcamp Prepare your submission Mental health & beyond Example theses
  • Meetings
  • FAQ
  • Contact & About
  • Thesis outline
    • Introduction
    • Literature review
      • Synthesis of the literature
      • Explaining your contribution
      • Visualizing your contribution
    • Conceptual framework
      • Hypotheses versus expectations
      • Example frameworks
    • Data
      • Describe your raw data
      • Prepare your final data set
      • Operationalize your variables
      • Provide descriptive statistics of your final data set
      • Provide relevant plots of your final data set
    • Method
    • Results
      • Model selection
      • Report your results in a table
      • Explain your results
      • Visualize your results
      • Simulate "what-if" scenarios
    • Discussion and conclusion

Visualize your results

Please consider plotting some results. Good candidates are coefficients of your estimated models, including error bars.

Results2

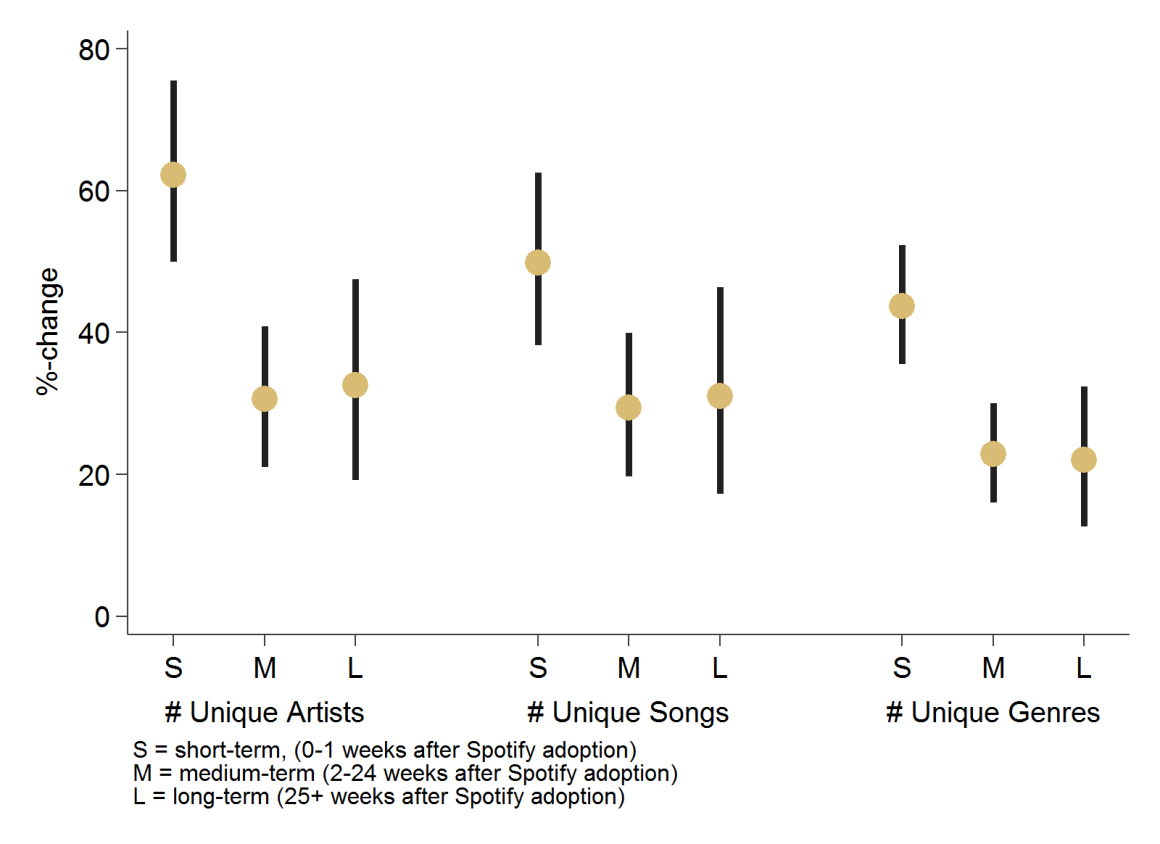
Source: Datta, H., Knox, G., & Bronnenberg, B. J. (2018). Changing their tune: How consumers’ adoption of online streaming affects music consumption and discovery. Marketing Science, 37 (1).

Results3

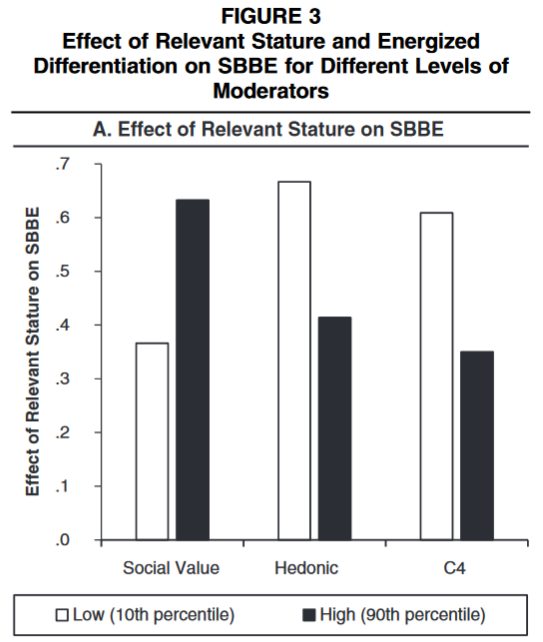
Source: Hannes Datta, Kusum L. Ailawadi, and Harald J. van Heerde (2017) How Well Does Consumer-Based Brand Equity Align with Sales-Based Brand Equity and Marketing-Mix Response? Journal of Marketing: May 2017, Vol. 81, No. 3, pp. 1-20.

Updated on 18 Jul 2022

Explain your results Simulate "what-if" scenarios

© Hannes Datta 2022.