Please consider plotting interesting aspects of your data. Usually, plots require transformations to your data (i.e., you cannot plot the final data set, but you may have to aggregate the data even more).
Visualizations are particularly useful to illustrate the existence of your main phenomena (i.e., your research question), even before model estimation! This is typically referred to as “model free evidence”. For example, in the plot below, I have illustrated that Spotify’s market share has been increasing, while the market share of ownership-based platforms (such as iTunes) has been diminishing.
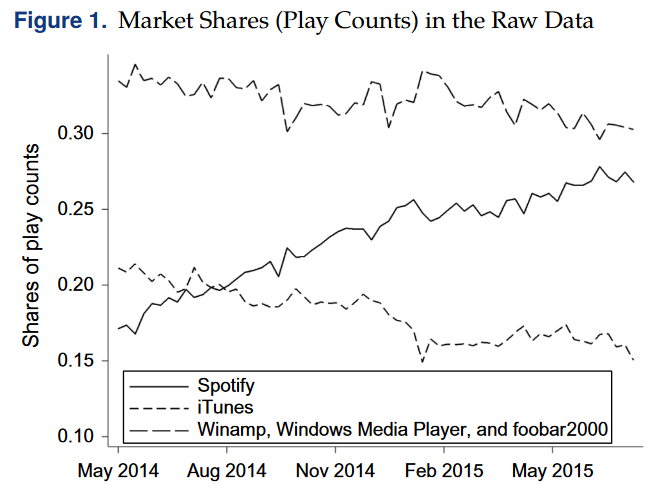
Source: Datta, H., Knox, G., & Bronnenberg , B. J. (2018). Changing their tune: How consumers’ adoption of online streaming affects music consumption and discovery. Marketing Science, 37 (1), 1-18.