Thesis Companion
  • Home
  • Guide
    Coaching and feedback Skills and software Topic and research question Finding literature Managing your raw data Project pipeline Thesis outline Writing bootcamp Prepare your submission Mental health & beyond Example theses
  • Meetings
  • FAQ
  • Contact & About
  • Thesis outline
    • Introduction
    • Literature review
      • Synthesis of the literature
      • Explaining your contribution
      • Visualizing your contribution
    • Conceptual framework
      • Hypotheses versus expectations
      • Example frameworks
    • Data
      • Describe your raw data
      • Prepare your final data set
      • Operationalize your variables
      • Provide descriptive statistics of your final data set
      • Provide relevant plots of your final data set
    • Method
    • Results
      • Model selection
      • Report your results in a table
      • Explain your results
      • Visualize your results
      • Simulate "what-if" scenarios
    • Discussion and conclusion

Provide descriptive statistics of your final data set

As a next step, you need to provide descriptive statistics of your final data set. Below, we list a few example tables. Please recall you can design tables (and figures) yourself, depending on the unique characteristics of your study.

Example 1 Descriptive statistics Example 1

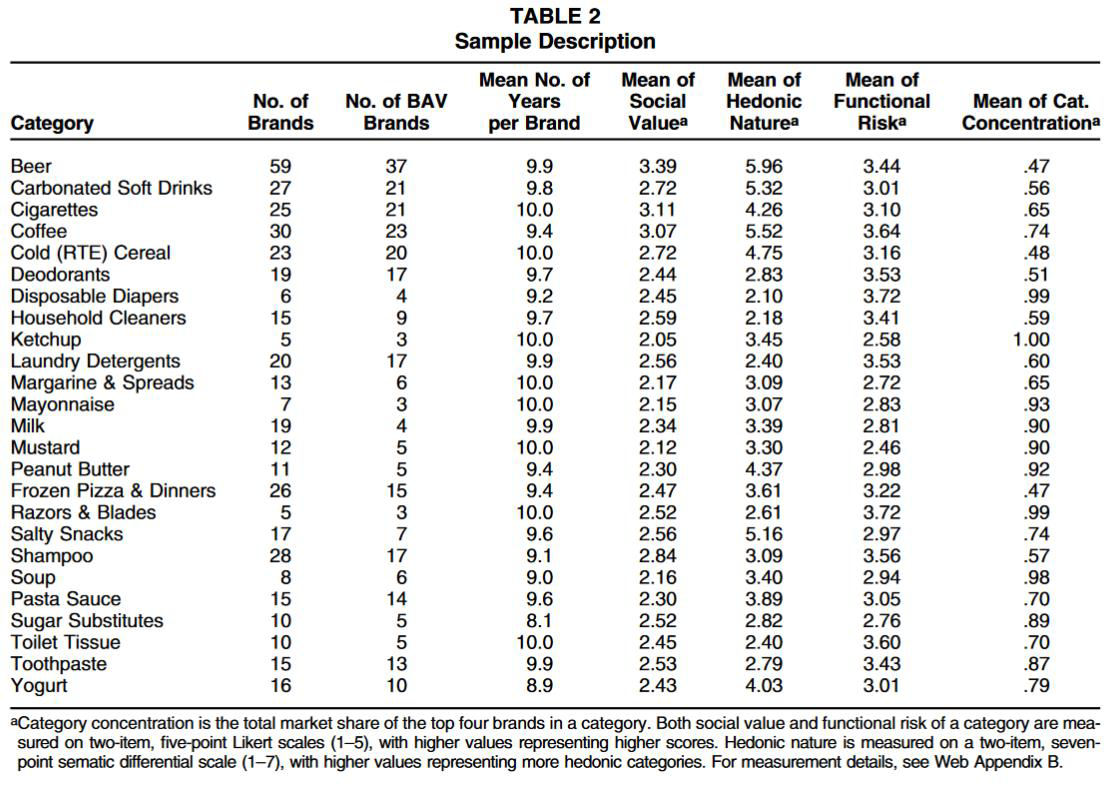
Source: Hannes Datta, Kusum L. Ailawadi , and Harald J. van Heerde (2017), How Well Does Consumer Based Brand Equity Align with Sales Based Brand Equity and Marketing Mi x Response?. Journal of Marketing: May 2017, Vol. 81, No. 3, pp. 1-20.

Example 2

Descriptive statistics Example 2

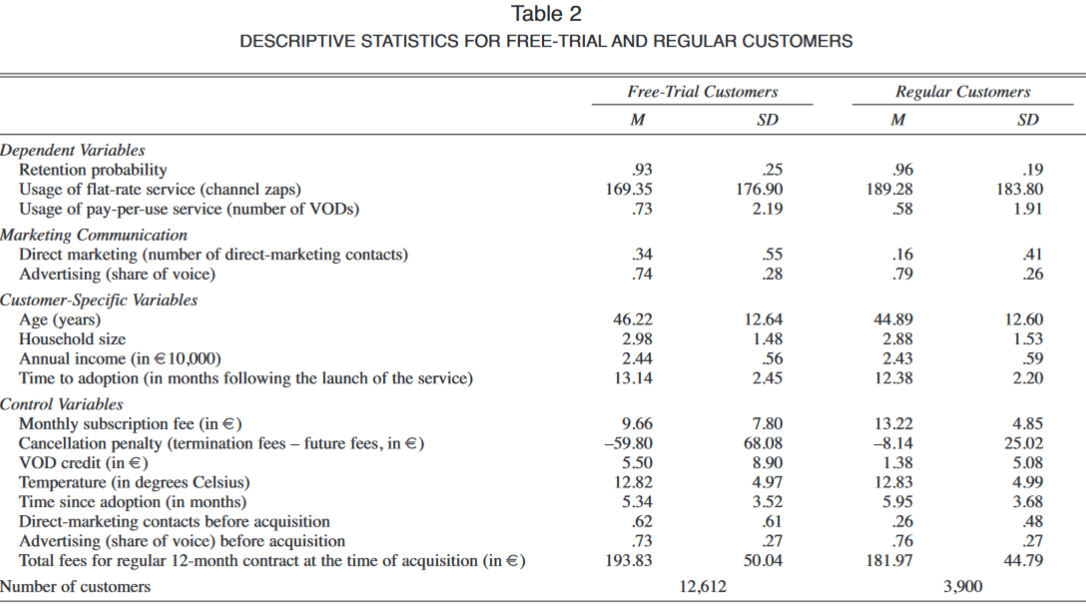
taken from: Datta, H., Foubert, B., & Van Heerde, H. J. (2015). The challenge of retaining customers acquired with free trials. Journal of Marketing Research, 52(2), 217-234.

Updated on 18 Jul 2022

Operationalize your variables Provide relevant plots of your final data set

© Hannes Datta 2022.